
Introduction
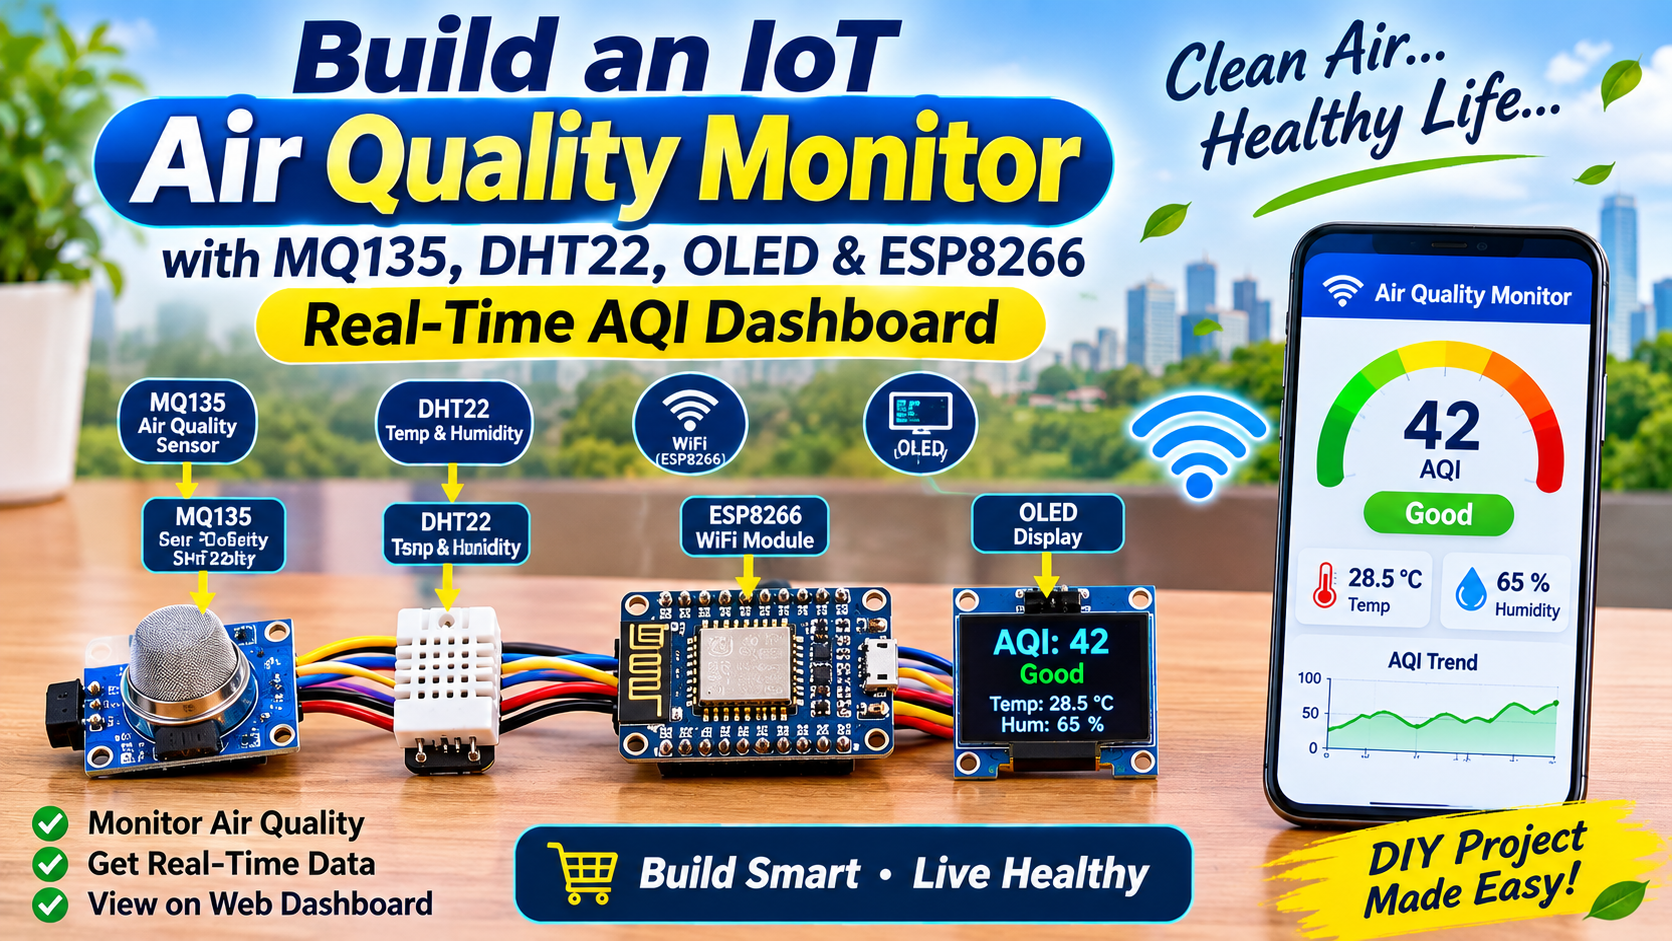
Air quality is invisible — but its impact on health is very real. Rising pollution levels, indoor gases from cooking, chemicals, and poor ventilation can silently affect your health without any warning. This project solves that with a compact, Wi-Fi connected IoT Air Quality Monitor that measures air pollution, temperature, and humidity in real time and displays the data on both a local OLED screen and a live web dashboard accessible from any phone or laptop.
Built around the NodeMCU ESP8266, MQ135 gas sensor, and DHT22 temperature-humidity sensor, this project is a perfect blend of environmental sensing and IoT connectivity. It is ideal for home air quality monitoring, college IoT projects, smart classroom systems, industrial safety alerts, and air pollution research.
All components are in stock at Anil Electronic Store, Ahmedabad — same-day dispatch with GST invoice.
What You'll Build
- A real-time air quality monitor measuring CO₂, smoke, ammonia, benzene and other gases via MQ135
- Temperature and humidity readings via DHT22
- Live AQI-style gauge displayed on a 0.96" OLED screen with status labels (Good / Moderate / Poor / Hazardous)
- A Wi-Fi hosted web dashboard showing live charts — accessible from any browser on your network
- Optional: buzzer alert when air quality drops below safe threshold
- Optional: ThingSpeak / Blynk cloud logging for historical data graphs
- Total build time: ~1.5 hours
How It Works
The system works in three parallel layers:
- Sensing layer: The MQ135 sensor heats its internal sensing element and measures the conductance change caused by target gases in the air, outputting an analogue voltage proportional to gas concentration. The DHT22 sensor uses a capacitive humidity sensor and thermistor to measure relative humidity and temperature, sending digital readings to the NodeMCU every 2 seconds.
- Processing layer: The NodeMCU ESP8266 reads the MQ135 analogue output on pin A0, converts it to a PPM (parts per million) value using a calibration formula, and reads the DHT22 digital data on D4. It calculates an AQI category (Good / Moderate / Poor / Hazardous) based on the PPM reading and updates the OLED display every 2 seconds.
- Output layer: Simultaneously, the NodeMCU runs a lightweight web server on port 80. Any device on the same Wi-Fi can open the NodeMCU's IP address in a browser and see a live dashboard with current readings, an AQI colour indicator, and auto-refreshing charts.
Understanding the MQ135 Sensor
The MQ135 is a semiconductor gas sensor that detects a wide range of harmful gases including:
- CO₂ (Carbon Dioxide) — from breathing, combustion
- NH₃ (Ammonia) — from fertilisers, cleaning products
- NOₓ (Nitrogen Oxides) — from vehicle exhaust, industrial emissions
- Alcohol vapours — from cleaning agents, solvents
- Benzene — from paints, plastics, tobacco smoke
- Smoke — from cooking, fires, cigarettes
The MQ135 module outputs both a digital signal (DO pin — high/low threshold trigger) and an analogue signal (AO pin — 0–5V proportional to gas concentration). We use the analogue output for accurate PPM readings in this project.
⚠️ Important warm-up note: The MQ135 requires a 24–48 hour burn-in period when used for the first time, and a 2–3 minute warm-up every time it is powered on before readings stabilise. The code accounts for this with a startup delay.
AQI Categories Used in This Project
| PPM Range | AQI Category | Meaning |
|---|---|---|
| 0 – 400 | 🟢 Good | Fresh, clean air — normal outdoor levels |
| 401 – 700 | 🟡 Moderate | Acceptable — slightly elevated indoor CO₂ |
| 701 – 1000 | 🟠 Poor | Noticeable odour, ventilate the room |
| 1001 – 2000 | 🔴 Unhealthy | Open windows immediately, leave the area |
| 2001+ | 🚨 Hazardous | Evacuate — dangerous gas levels detected |
Components Required (BOM)
All components are in stock at anilestore.com with same-day dispatch before 2 PM. See the kit panel on this page to add everything in one click.
Circuit Connections
MQ135 Gas Sensor Module → NodeMCU ESP8266:
- VCC → 3.3V (or 5V for higher sensitivity)
- GND → GND
- AO (Analogue Out) → A0 (NodeMCU's only ADC pin)
- DO (Digital Out) → D5 (optional — for threshold alert only)
DHT22 Temperature & Humidity Sensor → NodeMCU ESP8266:
- VCC (Pin 1) → 3.3V
- DATA (Pin 2) → D4
- GND (Pin 4) → GND
- Connect a 10kΩ pull-up resistor between DATA and VCC
0.96" I2C OLED Display → NodeMCU ESP8266:
- VCC → 3.3V
- GND → GND
- SDA → D2 (GPIO4)
- SCL → D1 (GPIO5)
Active Buzzer → NodeMCU ESP8266:
- Positive → D6 (GPIO12)
- Negative → GND
Power:
- Power the NodeMCU via Micro USB from a 5V USB adapter or power bank
- The NodeMCU's onboard 3.3V regulator powers MQ135, DHT22, and OLED
- For portable use, use an 18650 Li-ion battery with a TP4056 charger and 5V boost converter
⚠️ Important: The NodeMCU ESP8266 has only one analogue input pin (A0), and it accepts a maximum of 3.3V. The MQ135 analogue output can go up to 5V. Add a simple voltage divider (10kΩ and 3.3kΩ resistors) between AO and A0 to scale 5V to ~3.3V, protecting the NodeMCU's ADC. Alternatively, power the MQ135 from 3.3V directly for lower output range.
Required Libraries
Install via Arduino IDE → Sketch → Include Library → Manage Libraries:
- DHT sensor library by Adafruit — search "DHT sensor library"
- Adafruit Unified Sensor by Adafruit — required dependency
- Adafruit SSD1306 by Adafruit — for OLED display
- Adafruit GFX Library by Adafruit — required by SSD1306
- MQ135 by GeorgK — search "MQ135" for PPM calculation
- ESP8266WiFi — built into the ESP8266 board package, no install needed
Also ensure the ESP8266 board package is installed:
- File → Preferences → Additional Board Manager URLs:
http://arduino.esp8266.com/stable/package_esp8266com_index.json - Tools → Board → Board Manager → search esp8266 → install
- Select board: NodeMCU 1.0 (ESP-12E Module)
Arduino Code — IoT Air Quality Monitor
// IoT Air Quality Monitor
// MQ135 + DHT22 + OLED + NodeMCU ESP8266
// Anil Electronic Store – anilestore.com

#include <ESP8266WiFi.h>
#include <Wire.h>
#include <Adafruit_GFX.h>
#include <Adafruit_SSD1306.h>
#include <DHT.h>
#include <MQ135.h>

// ===== CONFIGURE THESE =====
const char* ssid     = "YOUR_WIFI_SSID";
const char* password = "YOUR_WIFI_PASSWORD";
// ===========================

// Pin Definitions
#define DHTPIN      D4
#define DHTTYPE     DHT22
#define MQ135_PIN   A0
#define BUZZER_PIN  D6
#define MQ135_DO    D5

// OLED (128x64, I2C address 0x3C)
#define SCREEN_WIDTH  128
#define SCREEN_HEIGHT  64
#define OLED_RESET     -1
Adafruit_SSD1306 display(SCREEN_WIDTH, SCREEN_HEIGHT, &Wire, OLED_RESET);

DHT dht(DHTPIN, DHTTYPE);
MQ135 mq135(MQ135_PIN);
WiFiServer server(80);

// Thresholds
const int GOOD_MAX      = 400;
const int MODERATE_MAX  = 700;
const int POOR_MAX      = 1000;
const int UNHEALTHY_MAX = 2000;
const int ALERT_PPM     = 700; // Buzz at this level

float temperature = 0;
float humidity    = 0;
float ppm         = 0;
String aqiLabel   = "Good";
unsigned long lastRead = 0;

String getAQILabel(float ppmVal) {
  if (ppmVal <= GOOD_MAX)      return "Good";
  if (ppmVal <= MODERATE_MAX)  return "Moderate";
  if (ppmVal <= POOR_MAX)      return "Poor";
  if (ppmVal <= UNHEALTHY_MAX) return "Unhealthy";
  return "Hazardous";
}

void updateOLED() {
  display.clearDisplay();

  // Title bar
  display.setTextSize(1);
  display.setTextColor(SSD1306_WHITE);
  display.setCursor(10, 0);
  display.println("Air Quality Monitor");
  display.drawLine(0, 10, 127, 10, SSD1306_WHITE);

  // PPM reading — large
  display.setTextSize(2);
  display.setCursor(0, 14);
  display.print("AQ:");
  display.print((int)ppm);
  display.setTextSize(1);
  display.print(" ppm");

  // AQI Label
  display.setTextSize(1);
  display.setCursor(0, 34);
  display.print("Status: ");
  display.println(aqiLabel);

  // Temperature and Humidity
  display.setCursor(0, 46);
  display.print("Temp: ");
  display.print(temperature, 1);
  display.print("C  Hum:");
  display.print(humidity, 0);
  display.print("%");

  // Wi-Fi IP
  display.setCursor(0, 56);
  display.setTextSize(1);
  display.print(WiFi.localIP().toString());

  display.display();
}

void buzzAlert() {
  for (int i = 0; i < 3; i++) {
    digitalWrite(BUZZER_PIN, HIGH);
    delay(200);
    digitalWrite(BUZZER_PIN, LOW);
    delay(150);
  }
}

String buildDashboard() {
  String color = "#22c55e"; // green
  if (aqiLabel == "Moderate")  color = "#eab308";
  if (aqiLabel == "Poor")      color = "#f97316";
  if (aqiLabel == "Unhealthy") color = "#ef4444";
  if (aqiLabel == "Hazardous") color = "#7c3aed";

  String html = "HTTP/1.1 200 OK\r\nContent-Type: text/html\r\n\r\n";
  html += "<!DOCTYPE html><html><head>";
  html += "<meta charset='UTF-8'>";
  html += "<meta name='viewport' content='width=device-width,initial-scale=1'>";
  html += "<meta http-equiv='refresh' content='5'>";
  html += "<title>Air Quality Monitor</title>";
  html += "<style>";
  html += "body{font-family:sans-serif;background:#0f172a;color:#f1f5f9;margin:0;padding:20px;}";
  html += "h1{color:#60a5fa;text-align:center;font-size:1.4em;}";
  html += ".grid{display:grid;grid-template-columns:1fr 1fr;gap:16px;max-width:500px;margin:20px auto;}";
  html += ".card{background:#1e293b;border-radius:12px;padding:20px;text-align:center;}";
  html += ".val{font-size:2.2em;font-weight:600;margin:8px 0;}";
  html += ".lbl{font-size:0.85em;color:#94a3b8;}";
  html += ".aqi{background:" + color + "22;border:2px solid " + color + ";border-radius:12px;";
  html += "padding:16px;text-align:center;max-width:500px;margin:16px auto;}";
  html += ".aqi-val{font-size:3em;font-weight:700;color:" + color + ";}";
  html += ".aqi-lbl{font-size:1.1em;color:" + color + ";margin-top:4px;}";
  html += ".footer{text-align:center;color:#475569;font-size:0.8em;margin-top:24px;}";
  html += "</style></head><body>";
  html += "<h1>IoT Air Quality Monitor</h1>";
  html += "<div class='aqi'>";
  html += "<div class='lbl'>Air Quality Index</div>";
  html += "<div class='aqi-val'>" + String((int)ppm) + " ppm</div>";
  html += "<div class='aqi-lbl'>" + aqiLabel + "</div>";
  html += "</div>";
  html += "<div class='grid'>";
  html += "<div class='card'><div class='lbl'>Temperature</div>";
  html += "<div class='val'>" + String(temperature, 1) + "</div><div class='lbl'>°C</div></div>";
  html += "<div class='card'><div class='lbl'>Humidity</div>";
  html += "<div class='val'>" + String(humidity, 0) + "</div><div class='lbl'>%RH</div></div>";
  html += "</div>";
  html += "<div class='footer'>Auto-refreshes every 5 seconds · Powered by NodeMCU ESP8266<br>";
  html += "anilestore.com · Ahmedabad</div>";
  html += "</body></html>";
  return html;
}

void setup() {
  Serial.begin(115200);
  pinMode(BUZZER_PIN, OUTPUT);
  pinMode(MQ135_DO,   INPUT);
  digitalWrite(BUZZER_PIN, LOW);

  // OLED init
  Wire.begin(D2, D1);
  if (!display.begin(SSD1306_SWITCHCAPVCC, 0x3C)) {
    Serial.println("OLED not found!");
  }
  display.clearDisplay();
  display.setTextColor(SSD1306_WHITE);
  display.setTextSize(1);
  display.setCursor(10, 20);
  display.println("Air Quality Monitor");
  display.setCursor(20, 36);
  display.println("Connecting Wi-Fi...");
  display.display();

  dht.begin();

  // MQ135 warm-up delay
  Serial.println("MQ135 warming up — please wait 2 minutes...");
  delay(120000); // 2 minute warm-up

  // Wi-Fi connect
  WiFi.begin(ssid, password);
  Serial.print("Connecting to Wi-Fi");
  while (WiFi.status() != WL_CONNECTED) {
    delay(500);
    Serial.print(".");
  }
  Serial.println("\nConnected! IP: " + WiFi.localIP().toString());
  server.begin();

  // Boot beep
  digitalWrite(BUZZER_PIN, HIGH); delay(100);
  digitalWrite(BUZZER_PIN, LOW);
}

void loop() {
  // Read sensors every 2 seconds
  if (millis() - lastRead >= 2000) {
    temperature = dht.readTemperature();
    humidity    = dht.readHumidity();
    ppm         = mq135.getPPM();

    if (isnan(temperature) || isnan(humidity)) {
      Serial.println("DHT22 read failed!");
      temperature = 0;
      humidity    = 0;
    }

    aqiLabel = getAQILabel(ppm);

    Serial.print("PPM: "); Serial.print(ppm);
    Serial.print(" | Temp: "); Serial.print(temperature);
    Serial.print("C | Hum: "); Serial.print(humidity);
    Serial.print("% | AQI: "); Serial.println(aqiLabel);

    updateOLED();

    // Alert buzzer
    if (ppm > ALERT_PPM) {
      buzzAlert();
    }

    lastRead = millis();
  }

  // Handle web dashboard requests
  WiFiClient client = server.available();
  if (client) {
    String req = client.readStringUntil('\r');
    client.flush();
    client.print(buildDashboard());
    delay(1);
    client.stop();
  }
}
How to Use After Uploading
- Upload the sketch to NodeMCU via Micro USB.
- Open Serial Monitor at 115200 baud.
- Wait for the 2-minute MQ135 warm-up to complete — the OLED will show "Connecting Wi-Fi..."
- Once Wi-Fi connects, the IP address appears on the OLED's bottom line and in Serial Monitor.
- Open that IP address in any browser on the same network — your live dashboard loads instantly.
- The dashboard auto-refreshes every 5 seconds with fresh sensor readings.
- If PPM exceeds 700, the buzzer will alert with 3 short beeps.
Calibrating the MQ135 Sensor
For accurate PPM readings, the MQ135 must be calibrated in clean outdoor air. The MQ135 Arduino library handles this with an getRZero() function:
- Take the sensor outdoors or to a well-ventilated area with clean air
- Let it warm up for at least 5 minutes
- Upload a quick calibration sketch that prints
mq135.getRZero()to Serial Monitor - Note the printed value (e.g.,
76.34) — this is your sensor's RZero calibration constant - In the main code, replace the default RZero in the MQ135 library header file:
MQ135 mq135 = MQ135(A0, 76.34);(using your actual value)
Without calibration, the PPM values are still a useful relative indicator — just not scientifically precise absolute values.
Sending Data to ThingSpeak Cloud
To log historical data and view graphs over time, add ThingSpeak integration:
- Create a free account at thingspeak.com and create a channel with 3 fields: Air Quality (PPM), Temperature, Humidity
- Install the ThingSpeak library by MathWorks via Library Manager
- Add your ThingSpeak channel ID and write API key to the code
- Call
ThingSpeak.writeFields(channelID, writeAPIKey)every 15 seconds to upload readings - View your historical AQI graphs and temperature charts from anywhere in the world via the ThingSpeak dashboard
Step-by-Step Assembly
- Place the NodeMCU on the 830-point breadboard, straddling the centre channel. The NodeMCU ESP8266 has 15 pins on each side that plug directly into the breadboard.
- Place the MQ135 module at one end of the breadboard. Connect VCC to NodeMCU 3.3V, GND to GND, AO to A0. If powering MQ135 from 5V (via VIN pin), add the voltage divider (10kΩ + 3.3kΩ) between AO and A0 to protect the ADC.
- Wire the DHT22 sensor. Connect its 3 active pins to 3.3V, D4, and GND respectively. Place a 10kΩ resistor between the DATA pin and 3.3V on the breadboard as a pull-up.
- Wire the OLED display. Connect SDA to D2 and SCL to D1. VCC to 3.3V, GND to GND. The I2C bus means both OLED and any future I2C sensors share just these 2 data pins.
- Wire the buzzer. Connect positive to D6 and negative to GND. Use a 100Ω series resistor to limit current if your buzzer is rated below 5V.
- Double check all connections before powering on — particularly ensure A0 voltage never exceeds 3.3V. A wrong voltage here will permanently damage the NodeMCU's ADC.
- Upload the code via Micro USB and open Serial Monitor. Wait for warm-up and Wi-Fi connection.
- Open the web dashboard from the IP shown on the OLED. Breathe near the MQ135 — CO₂ from your breath will cause the PPM reading to rise within seconds, confirming the sensor works correctly.
Troubleshooting Tips
- PPM reading is very high at startup: Normal — this is part of the warm-up. MQ135 readings only stabilise after 2–3 minutes of heating. The 2-minute delay in the code handles this, but freshly unboxed sensors need 24–48 hours burn-in for accuracy.
- OLED shows nothing: Check SDA/SCL wiring (D2/D1). Try the I2C scanner sketch to confirm the OLED's address — most are 0x3C, some are 0x3D. Update the address in the
display.begin()call. - DHT22 returns NaN: Check the 10kΩ pull-up resistor on the DATA line. Ensure the sensor has at least 2 seconds between readings. Try a fresh DHT22 — these sensors can fail if powered above 5.5V.
- Web dashboard not loading: Ensure your phone/laptop is on the same Wi-Fi network as the NodeMCU. Check the IP address in Serial Monitor. Some routers isolate clients — try enabling "AP Isolation off" or use a hotspot for testing.
- NodeMCU resets randomly during operation: This is a watchdog reset, often caused by blocking the loop too long. The 2-minute warm-up delay may cause this on some boards. Use a timer-based warm-up instead, or increase the watchdog timeout using
ESP.wdtEnable(WDTO_8S).
Upgrades & Next Steps
- Add an MQ-2 smoke/LPG sensor alongside MQ135 for kitchen gas leak detection specifically
- Add a BMP280 barometric pressure sensor (I2C) alongside the existing sensors — pressure data alongside AQI gives a complete environment picture
- Replace the NodeMCU with an ESP32 for dual-core processing, more GPIO pins, and Bluetooth Low Energy broadcasting of AQI data
- Add a 1.3" larger OLED for a more detailed display with mini bar charts for each sensor reading
- Use Blynk IoT app for a beautiful mobile dashboard with push notifications when AQI crosses thresholds
- Use Node-RED + InfluxDB + Grafana for a professional time-series data logging and visualisation pipeline
- Add a small 5V fan controlled via MOSFET that automatically switches ON when air quality is poor — a self-ventilating monitor!
- Add a Nova PM SDS011 PM2.5 dust sensor for particulate matter monitoring alongside gas detection
Real-World Applications
- 🏠 Home air quality monitor — kitchen smoke, bathroom odour, indoor CO₂
- 🏫 Smart classroom system — CO₂ monitor that warns when ventilation is needed
- 🏭 Industrial safety monitor — alert workers to gas leaks in factories or labs
- 🌿 Greenhouse monitoring — CO₂ levels for optimal plant growth
- 🔬 Environmental research — outdoor AQI data logging for pollution studies
- 🚗 Vehicle cabin monitor — CO and CO₂ levels inside cars and buses
- 🏥 Hospital / clinic ventilation — ensure air quality standards are maintained
Why Buy from Anil Electronic Store?
- ✅ Genuine MQ135 modules — calibrated sensor elements, not cheap unreliable clones
- ✅ Genuine DHT22 sensors — ±0.5°C temperature accuracy, ±2–5% humidity accuracy
- ✅ NodeMCU ESP8266 V3 with CH340 USB chip — works out of the box on Windows, Mac, and Linux
- 🚚 Same-day dispatch for orders placed before 2 PM from Ahmedabad
- 🧾 Official GST invoice — perfect for college project budget reimbursements
- 📲 Free WhatsApp engineer support — we help debug your sensor readings and code
- 📦 Delivery across 19,000+ PIN codes in India
Conclusion
The IoT Air Quality Monitor with MQ135, DHT22, OLED, and ESP8266 is a genuinely useful project that you'll continue using long after you build it. It transforms invisible air quality data into actionable, real-time information — displayed beautifully on a local OLED screen and a live web dashboard accessible from any device on your network.
Whether you're building it for a college project, a smart home upgrade, an industrial safety system, or environmental research — this monitor is accurate, expandable, and built entirely from affordable components available at Anil Electronic Store.
Order before 2 PM for same-day dispatch across India. Breathe smart. Build smarter. 🌬️⚡